Creates polar plots. All data sets must be sampled on the same array of angle values.
See polar2 for data sets that are sampled on different arrays of theta values.
|
Syntax |
Description |
|---|---|
|
out = polar(theta,rho) |
Creates a polar coordinate plot of the angle theta versus the radius rho. theta is the angle from the x-axis to the radius vector specified in radians; rho is the length of the radius vector. Theta and rho can be vectors of the same length, or if the length of theta is n, then rho can be a nxm matrix, which corresponds to m sets of rho values. The figure number is returned. |
|
polar(theta,rho1,rho2,rho3) |
Creates a polar plot with three curves. theta, rho1, rho2, rho3 must be of the same length. The figure number is returned. |
|
polar(theta,rho,"x label", "y label", "title") |
Creates a polar plot with axis labels and a title. The figure number is returned. |
|
polar(theta,rho,"x label", "y label", "title", "options"); |
Creates a polar plot with desired options. Options can be be
Returns the figure number. |
Example
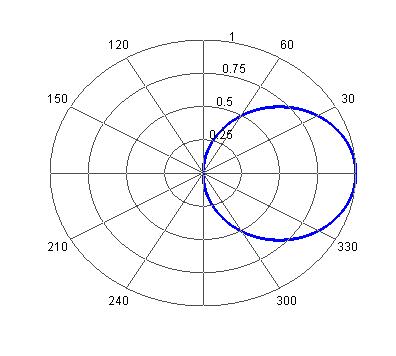
Create a simple polar plot.
theta = linspace(0,2*pi,100);
r = cos(theta);
polar(theta,r);
The following figure shows the output of the the example code.
See Also
List of commands , polar2 , legend , image , closeall , setplot , exportfigure , polarimage , plot