Holds multiple functions on a single plot. Note that, only the labeling and plot options of the first plot are taken into account; a warning is reported in this case. The command setplot can be used instead.
|
Syntax |
Description |
|---|---|
|
holdon; |
Switches on the mode to hold multiple mathematical functions on the same figure. |
Example
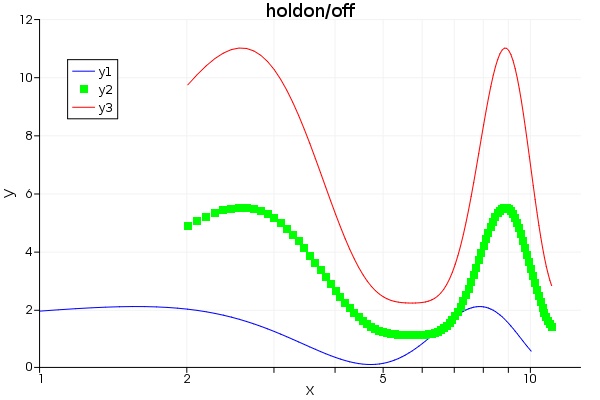
This example will generate a figure with three lines based on the sin(x) function.
# setup data
# for logarithm, avoid non-positive values
x1=linspace(1,10,100);
x2=linspace(2,11,100);
y1=sin(x1)+1.1;
y2=y1^2+1.1;
# plot y1, y2, y3
plot(x1,y1,"x","y","holdon/off","log10x");
holdon;
plot(x2,y2,"xx","yy","title1","log10y, plot points");
plot(x2,2*y2, "xxx","yyy", "title2", "greyscale");
# plot labeling and options cannot work in hold on
# use setplot command instead!
legend("y1","y2","y3");
holdoff;
The following figure shows the output of the the example code.
See Also
List of commands , plot , plotxy , legend , setplot , log , log10 , holdoff