Creates a vector plot from a rectilinear dataset. The rectilinear dataset must be a vector, like the E field, and it must have no additional parameters (i.e., if you have E vs. x,y,z,f and f has two or more values, then the command fails). Generally, it is easier to use visualize(E) and then select the vector plot option in the visualizer.
|
Syntax |
Description |
|---|---|
|
vectorplot(E); |
Creates a vector plot of the dataset |
Example
This example will generate a vector plot of the dataset E.
x = linspace(-1,1,10);
y = x;
z = x;
X = meshgrid3dx(x,y,z);
Y = meshgrid3dy(x,y,z);
Z = meshgrid3dz(x,y,z);
Ex = exp( -X^2-Y^2-Z^2);
Ey = 0*Ex;
Ez = 0*Ex;
E = rectilineardataset("E",x,y,z);
E.addattribute("E",Ex,Ey,Ez);
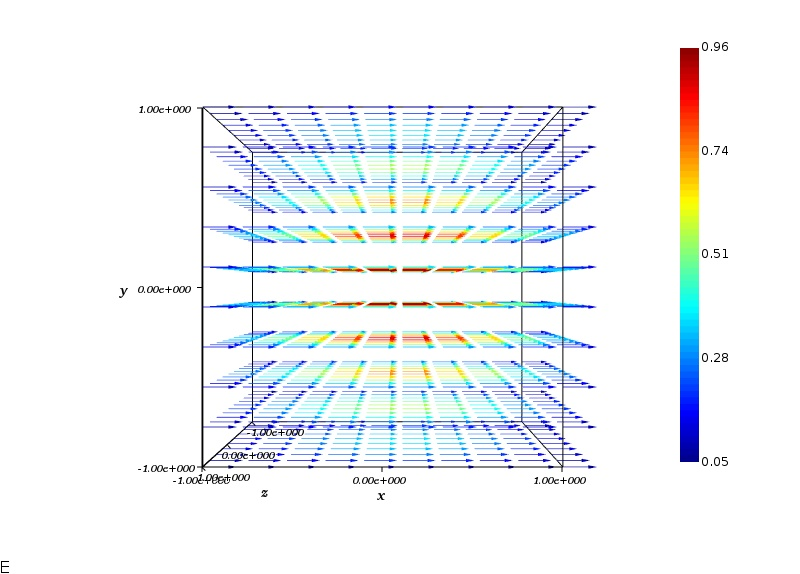
vectorplot(E);
The following figure shows the output of the the example code.
See Also
List of commands, plotxy, legend, image, closeall, setplot, exportfigure, plot