Creates line plots. All data sets must be sampled on the same position vector.
See plotxy for data sets that are sampled on different position vectors.
|
Syntax |
Description |
|---|---|
|
out = plot(x,y); |
Creates a plot of y vs x, y and x are both 1D vectors with the same length. The figure number is returned. |
|
plot(x,y); |
x is a nx1 matrix. y is a nxm matrix. This will generate a graph with m lines. (y(1:n,1) vs x, y(1:n,2) vs x, etc) |
|
plot(x,y1,y2,y3); |
Creates a plot with 3 curves, x,y1, y2, y3 must be the same length, returns the figure number. |
|
plot(x,y, "x label", "y label", "title"); |
Creates a plot of y vs x with axis labels and a title, returns the figure number. |
|
plot(x,y, "x label", "y label", "title", "options"); |
Creates a plot with desired options. Options are listed in the table below. Returns the figure number. |
Plot options. May include multiple plot options in a single string, such as
"plot type=line, color=blue, pen=--, linewidth=2"
|
plot type |
line point bar |
|
marker style |
x o + s (square) d (diamond) |
| pen |
-- : -. -.. |
|
x axis location |
top bottom |
|
y axis location |
left right |
|
color |
blue red etc. |
|
greyscale |
|
|
plot lines |
|
| plot bar | |
| plot points | |
| marker size (default=4) | # |
| linewidth (default=1) | # |
Examples
This example will generate a figure with two lines: sin(x) and (sin(x))^2.
x=linspace(0,10,100);
y1=sin(x);
y2=y1^2;
plot(x,y1,y2,"x","y","title");
legend("sin(x)", "sin(x)^2");
The following figure shows the output of the the example code.

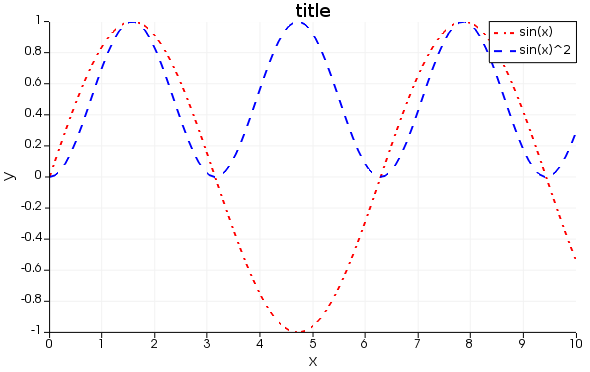
This example will generate a figure with two lines: sin(x) and sin(x)^2 with more plotting options.
x=linspace(0,10,100);
y1=sin(x);
y2=y1^2;
plot(x,y1,"x","y","title", "plot type=line, color=red, pen=-., linewidth=2");
holdon;
plot(x,y2,"x","y","title", "plot type=line, color=blue, pen=--, linewidth=2");
legend("sin(x)", "sin(x)^2");
The following figure shows the output of the the example code.
See Also
plotxy, holdon, legend, image, closeall, setplot, exportfigure, visualize, vectorplot, polar