Samples function on a Chebyshev grid. Chebyshev interpolation is useful for accurately interpolating a smooth function using a very small number of samples. The key requirement for this type of interpolation to work is that the function is sampled on the Chebyshev roots grid, which can be done by using this command.
|
Syntax |
Description |
|---|---|
|
x=chpts(xmin,xmax,NumPts,option); |
Returns Chebyshev roots grid on interval between xmin and xmax that can be used to sample a smooth function. NumPts defines the number of points on given interval. Option: If option=1 is selected, the vector x will not include the endpoints If option=2 is selected, the vector x will include the endpoints |
Example
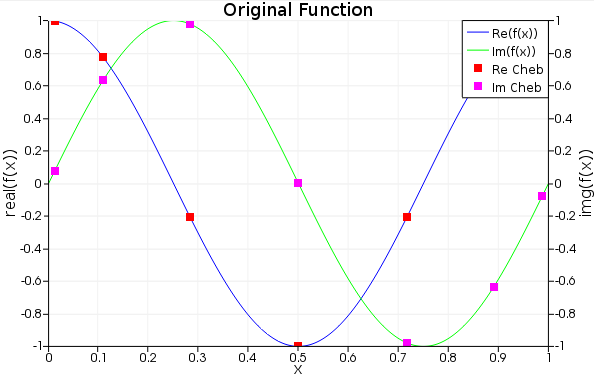
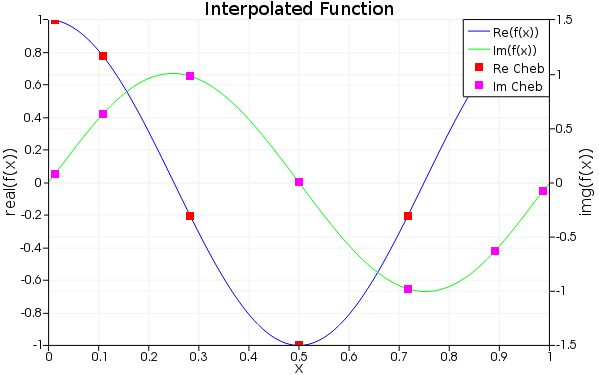
This example uses the chpts to sample a smooth function on an interval from 0 to 1 with 7 points. The function is then interpolated with chebin command and compared with the original sampled function.
# Sample function on Chebyshev grid
xmin = 0;
xmax = 1;
Nc = 7;
x = chpts(xmin,xmax,Nc,1);
f = exp(1i*2*pi*x);
###############################################################
# Interpolation and comparison to the original sampled function
# Fine sampling for display
Ni = 500;
xi = linspace(xmin,xmax,Ni);
fi = exp(1i*2*pi*xi);
# Plot function and its samples on the Chebyshev grid
plot(xi,fi,"x","f(x)","Original Function");
holdon;
plot(x,f,"x","f(x)","Original Function","plot points");
holdoff;
legend("Re(f(x))","Im(f(x))","Re Cheb","Im Cheb");
setplot("y max",1);
setplot("y min",-1);
# Chebyshev interpolation
fi = chebin(f,x,xi,xmin,xmax);
# Plot function and its samples on the Chebyshev grid
plot(xi,fi,"x","f(x)","Interpolated Function");
holdon;
plot(x,f,"x","f(x)","Interpolated Function","plot points");
holdoff;
legend("Re(f(x))","Im(f(x))","Re Cheb","Im Cheb");
setplot("y max",1);
setplot("y min",-1);
See Also