In this example, we use INTERCONNECT to study the Optical QPSK + Electrical 16QAM system. In this example you will learn how to:
- Generate 16QAM signals using MAP
- Conduct QPSK transceiver in INTERCONNECT
- User define symbol map table
- Map signals and measure signal quality
Problem Definition
This sample system combines an optical QPSK transceiver and an electrical 16QAM data generator. It demonstrates the usage of a QPSK receiver and user defined symbol map table to map a 16QAM constellation like received signals.
Modeling instructions
Set up Model
- Start a new INTERCONNECT project. You can start a new project by pressing Ctrl+N, or by selecting New in the File menu.
- To generate a 16QAM modulation signal and shift all the electrical signals to fit in the [0,2V] MZM driving voltage range, drag and drop the following elements and connect them as shown::
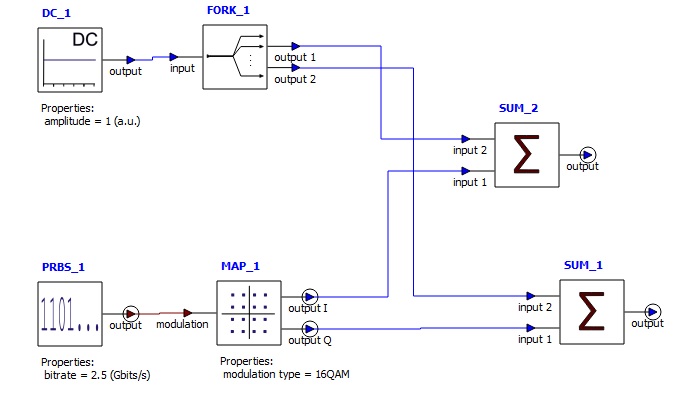
Set the MAP "modulation type" to be 16QAM with the "symbol map table" as following:
|
Matrix Editor |
|||
|---|---|---|---|
|
1 |
2 |
Symbol |
|
|
1 |
1 |
1 |
0000 |
|
2 |
3 |
1 |
0001 |
|
3 |
1 |
3 |
0010 |
|
4 |
3 |
3 |
0011 |
|
5 |
1 |
-1 |
0100 |
|
6 |
1 |
-3 |
0101 |
|
7 |
3 |
-1 |
0110 |
|
8 |
3 |
-3 |
0111 |
|
9 |
-1 |
1 |
1000 |
|
10 |
-1 |
3 |
1001 |
|
11 |
-3 |
1 |
1010 |
|
12 |
-3 |
3 |
1011 |
|
13 |
-1 |
-1 |
1100 |
|
14 |
-3 |
-1 |
1101 |
|
15 |
-1 |
-3 |
1110 |
|
16 |
-3 |
-3 |
1111 |
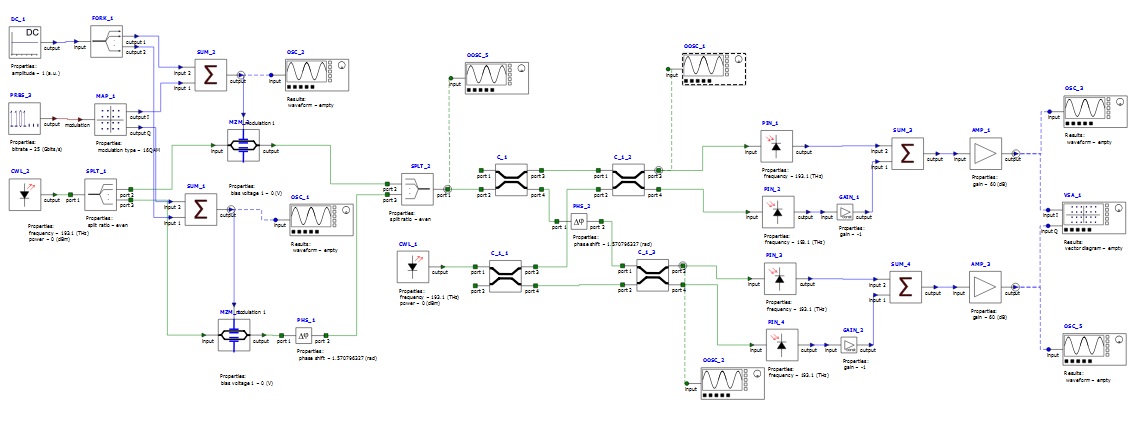
- To generate a QPSK transceiver, drag and drop the following elements and connect the system as shown below, detail information about QPSK transceiver can be found at Optical QPSK.
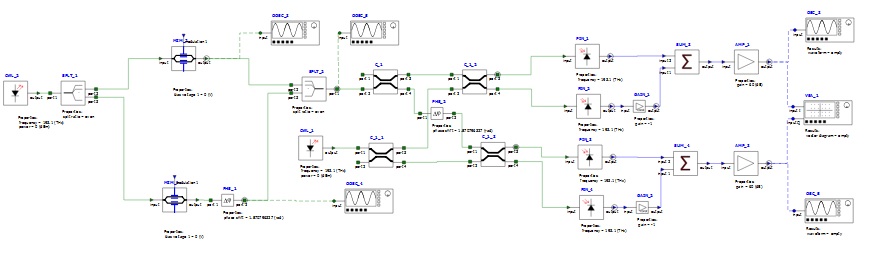
- Use the two electrical signals to drive the MZM for modulation, connect the circuit as shown following:
Note that we use a 16QAM electrical signal to drive a QPSK transceiver system, to visualize the symbol mapping, we can either use the build in 16QAM "symbol map table" in VSA or, by setting the "load map from file" to be true, we can customize the mapping table. Under the "symbol map filename" column, upload the following symbol map table dat file for a user defined mapping:
|
Matrix Editor |
|||
|---|---|---|---|
|
1 |
2 |
Symbol |
|
|
1 |
0.25 |
0.5 |
0000 |
|
2 |
0.5 |
-0.5 |
0001 |
|
3 |
-0.5 |
-0.25 |
0010 |
|
4 |
-0.5 |
0.25 |
0011 |
|
5 |
0.25 |
-0.5 |
0100 |
|
6 |
-0.25 |
-0.5 |
0101 |
|
7 |
-0.25 |
0.5 |
0110 |
|
8 |
0.5 |
-0.25 |
0111 |
|
9 |
0.5 |
0.25 |
1000 |
|
10 |
0.5 |
0.5 |
1001 |
|
11 |
-0.5 |
0.5 |
1010 |
|
12 |
-0.5 |
-0.5 |
1011 |
|
13 |
-0.25 |
-0.25 |
1100 |
|
14 |
0.25 |
-0.25 |
1101 |
|
15 |
-0.25 |
0.25 |
1110 |
|
16 |
0.25 |
0.25 |
1111 |
Run Simulation, Visualize Results
- To run the simulation, click on the run button
on the tool bar. When a simulation is running, the calculation process will appear at the top of the analyzer.

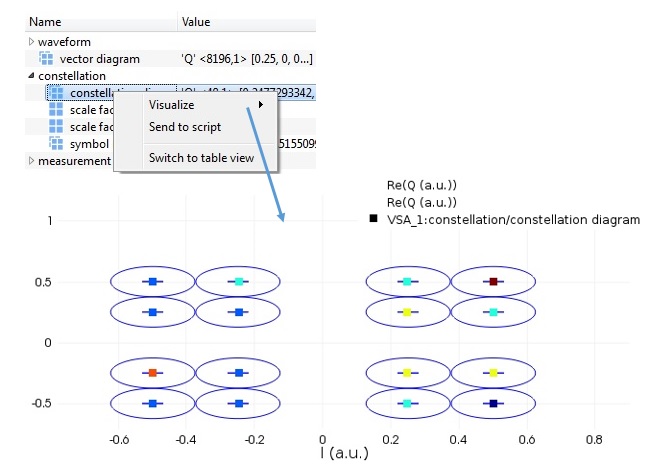
- When the simulation finishes running, the Results Window of the Analyzers will be populated with results. Users can simply right-click on each result to visualize this in the Visualizer window. For example, to look at the symbol mapping, select the VSA, go to the results window and right-click on the "constellation diagram" and "symbol map" results and select "Visualize".
Discussion and results
Signal integrity analysis is done by special elements, the analyzers. Analyzers allows for post-processing of data stored in monitors. Analyzers can be inserted at different points of the circuit for detailed analysis of the signal evolution from the transmitter to the receiver.
At the 16QAM signal generation stage, the 16QAM MAP modulates the signals according to the mapping shown below, then the separated in-phase part and quadrature-phase part are added to a DC source to shift up the electrical signal voltage to the [0, 2V] MZM driving voltage range.
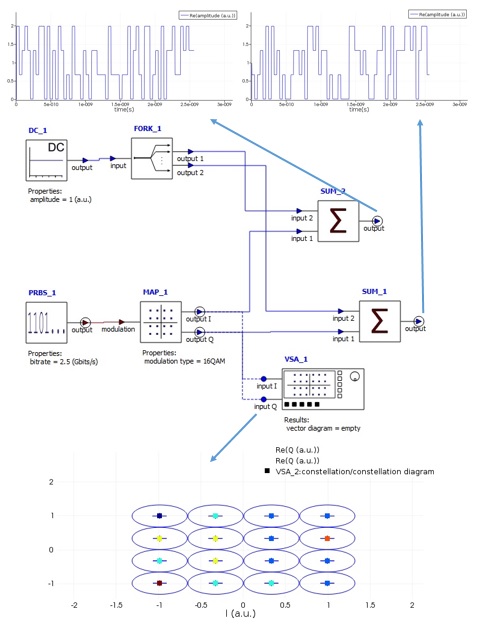
Signal waveforms at different transmission stages can also be visualized and measured in the system.
![]()
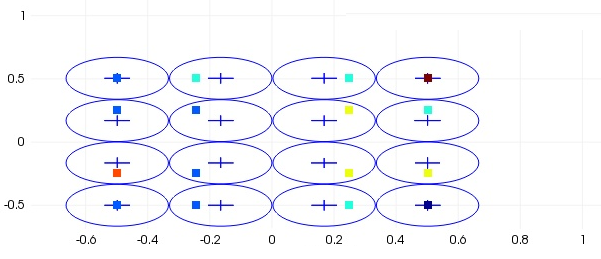
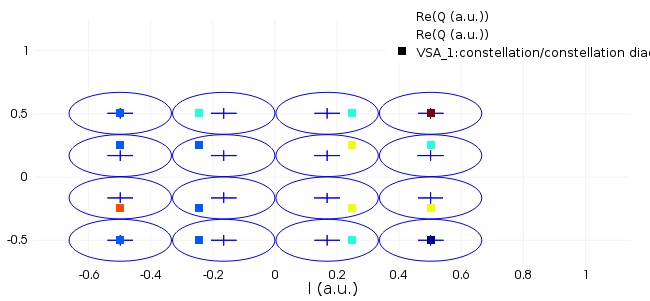
At the receiver, to map the symbols and measure the signal quality, both the build in 16QAM mapping table and customized mapping table as discussed in Modeling Instruction can be used. When using the 16QAM "symbol map table", set the "normalize IQ values" to be true, the symbol mapping and measurements are shown as following:
When using the user defined "symbol map table", disable the "normalize IQ values", the symbol mapping and measurements are shown as following:
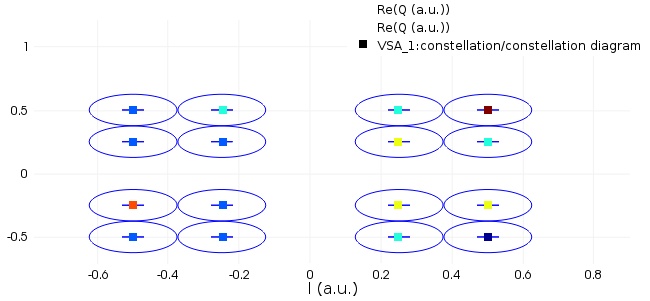
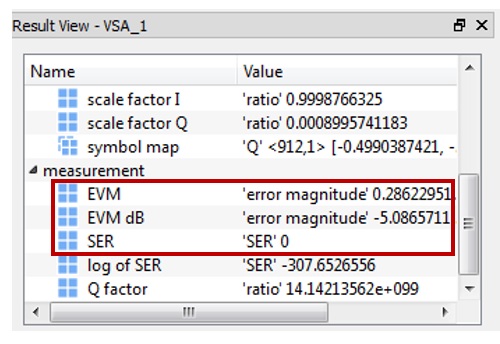
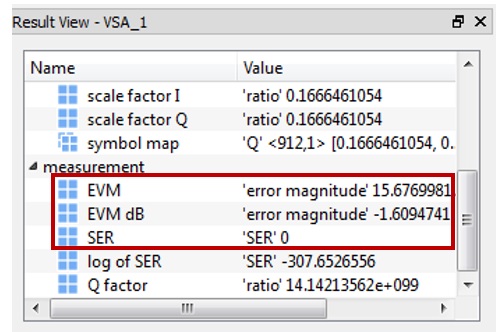
Even though the two mapping tables both give 0 symbol error rates (SER), the lower error vector magnitude (EVM) indicates that the customized mapping table fits the signals better.