In this example, we analyze a gap surface plasmon waveguide, and determine the propagation loss of that structure at a wavelength of 1550 nm for different waveguide widths using the FDE solver in MODE. We also investigate end-fire coupling efficiency with high NA beams and vertical coupling efficiency into an optical antenna structure to determine the optimum way to couple light into the gap surface plasmon waveguide.
Simulation setup
MODE
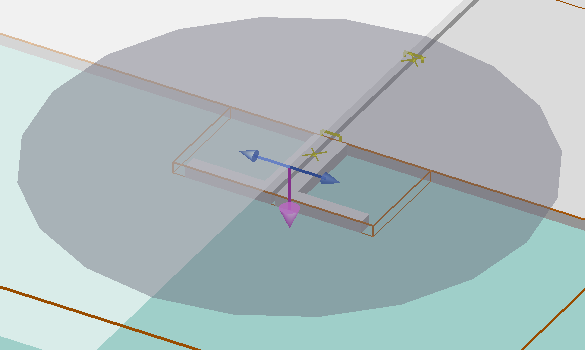
The file GPW.lms sets up the gap surface plasmon waveguide model as shown in the screenshot below. Mesh override regions are used over the structure and the gap in order to resolve the rapid field variations present in surface plasmon mode.

In the Eigensolver Analysis window (shown below), one can easily find the mode(s) of interest by scanning through a specific refractive index range, or searching near the maximum refractive index at the wavelength of operation.

To find the modes of interest, scan over refractive indices between the low-index core and the high-index cladding layers. Each mode found is expressed in terms of effective index, propagation loss configured in length units expressed by the user, and the polarization in the Mode List table. The user interface allows one to quickly plot the individual electric and magnetic field components, electric and magnetic field intensities, the energy density, and the x, y, z Poynting vectors. This analysis can also be done from the script which is what is done in this example.
FDTD
To analyze the coupling efficiency of the optical antenna structure, a 3D model is simulated in FDTD in the GPW.fsp simulation file. The optical antenna consists of two electrodes with 90 degree stub sections, illuminated with a high NA beam focused on the center of the antenna.
The polarization of the high NA source is oriented perpendicular to the direction of waveguide propagation to couple light in from the vertical direction, and a power monitor is placed over the cross section of the waveguide at the end of the antenna to measure the power flow through that surface normalized to the source power which provides the coupling efficiency of the antenna. The power monitor is within the "power analysis" analysis group in the Objects Tree, and the "T1" result from the analysis group gives the coupling efficiency.
In the Optimizations and Sweeps window, a parameter sweep named "NA" sweeps over the numerical aperture of the source and collects the coupling efficiency. Another parameter sweep named "beam_position" sweeps the location of the beam and collects the coupling efficiency.
Results
Calculate how the imaginary part of the gap surface plasmon waveguide propagation constant varies with waveguide width
Run the MODE_simulation_width.lsf script file with the GPW.lms simulation file to calculate how the imaginary part of the gap surface plasmon waveguide propagation constant varies with waveguide width. The width of the metal waveguide arms are varied from 50 to 150 nm, and the imaginary part of the propagation constant is recorded. In the limit of very wide waveguides, a propagation constant of about 1.68 + 0.026i is calculated.

Calculate the coupling efficiency of end-fire coupling a high NA source into the gap surface plasmon waveguide
Run the MODE_simulation_endfire.lsf script file with the GPW.lms simulation file to calculate the coupling efficiency of end-fire coupling a high NA source into the gap surface plasmon waveguide. A series of high numerical aperture modes ranging from NA=0.5 to NA=0.9 are recorded, and the power coupling between the input beams and the bulk waveguide mode is calculated. The script file also saves the power coupling data to a data file called MODE_transmission_vs_NA.ldf and the data is later reloaded to compare with the coupling efficiency for the vertical coupling simulation in FDTD.

The figure above shows that only about 3.5% - 9% (depending on the NA) of the incoming light is coupled into the gap surface plasmon waveguide mode, owing to the very high confinement of light within the air region between the two metal electrodes
Vertical coupling analysis and comparison to end fire coupling
Vertical coupling using an optical antenna structure is simulated using the GPW.fsp simulation file. In order to determine the optimal position to focus the source beam on the antenna structure structure, the "beam_position" parameter sweep project is used to run a series of simulations at different source locations and collect the coupling efficiency. The following plot shows that maximum coupling occurs at the beam position x=-0.5 um.

The "NA" parameter sweep project calculates the coupling efficiency of injecting light into the gap surface plasmon waveguide (for NA=0.5 to NA=0.9, as in step 2). After running the sweep projects, the FDTD_sweep_plot_results.lsf script file can be run to generate the plots of power coupling versus beam position and numerical aperture. The script file also stores the power coupling versus numerical aperture data in FDTD_transmission_vs_NA.ldf and compares the result with that of the end-fire coupling case if the MODE_transmission_vs_NA.ldf data file has already been generated using the earlier simulations using MODE.

Comparable coupling efficiencies on the order of 2-5% are obtained with high NA objectives. However, the integration benefits of coupling into the gap surface plasmon waveguide from the surface demonstrates the promise of utilizing such optical antenna structures to achieve high-density integrated optical components. In the case of the optical antenna, normalizing the coupled light to the power contained in a 1 micron diameter spot, as is done in Wen et al. yield coupling efficiencies in excess of 10%, as reported in that paper.
Related publications
- Jing Wen, Sergei Romanov, and Ulf Peschel, "Excitation of plasmonic gap waveguides by nanoantennas," Opt. Express 17, 5925-5932 (2009)
- A. Kriesch, S. P. Burgos, D. Ploss, H. Pfeifer, H. A. Atwater, and U. Peschel, "Functional plasmonic nanocircuits with low insertion and propagation losses.," Nano Lett. 13, 4539–45 (2013)