This page shows how to use FDTD to image sub-wavelength features that may be created using an APSM mask.
Reticle Enhancement Technique: Alternating Phase Shift Mask
The binary masks considered in the example Lithography using binary mask consist of an opaque chromium layer, in which the desired object pattern is etched, on a transparent fused quartz substrate. Binary masks modulate the intensity of the incident light without significantly affecting its phase. But as we see from that example, these binary masks are limited in the size of patterns that may be correctly projected as an aerial image.
Another type of mask, the alternating phase shift mask (APSM), controls the phase of the incident light by changing the thickness of the transparent regions of the mask, as well as modulating the intensity using an etched chrome layer. Here we consider a simple APSM design that exploits the optical phase to improve the resolution of the lithographic process.
Layout Editor
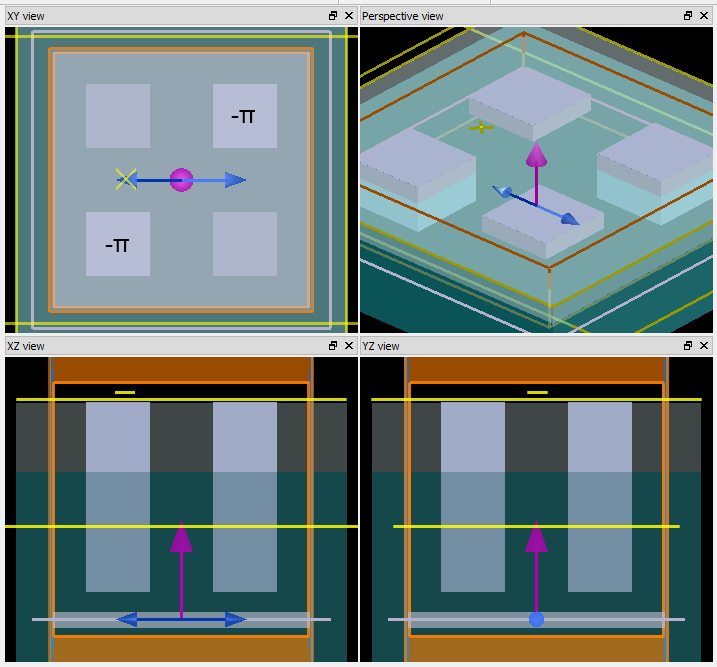
We now consider the simulation of a chrome APSM that contains a checkerboard array of squares windows, each square having an edge CD = 2λ and also being separated by the same CD = 2λ. For alternating squares, a portion of the underlying quartz substrate has been etched away. The depth of the etch is chosen so that there is a π phase difference between the optical wave propagating through the alternately etched windows. Load the simulation project file litho_4sq.fsp to review the setup in the Layout Editor as shown above. The phase-shift wells marked with the π symbols are those which introduce the π phase shift to the transmitted light.
APSM Object Field: Intensity & Phase
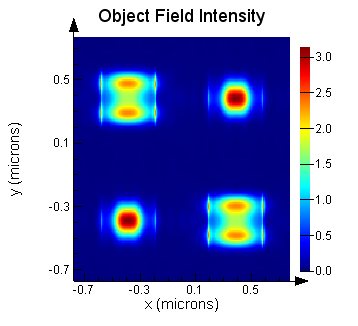
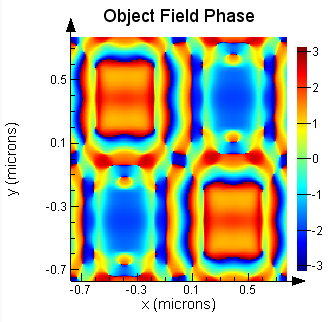
Run the plot_incoherent.lsf script file with the plot_fields value set to 1. We can look at the object field intensity at the lower surface of the mask. The left image below shows the field intensity transmitted through the APSM mask for a plane wave at normal incidence with x polarization, clearly illustrating that the field variation across each individual aperture is significant. The image on the right shows the phase of the field transmitted through the phase shift mask, and the π phase difference between adjacent wells.
x-polarization
Aerial Image Intensity, M=5
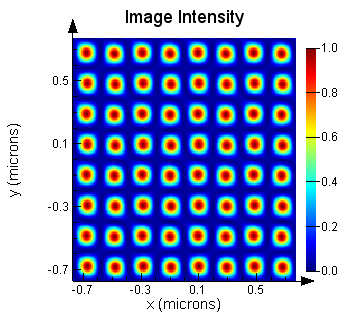
Next, run the script file with M=5. Using the same Fourier optics model, the aerial image is calculated just above the wafer in air. The resulting aerial image is plotted below for illumination conditions σ=0 (coherent), and imaging conditions NA= 0.85 and demagnification M=5.
See also
Simplified Microscopic Imaging