This example shows how to recreate the results of J. Zhou et al. This metamaterial exhibits a negative index of refraction in the GHz range.
Simulation setup
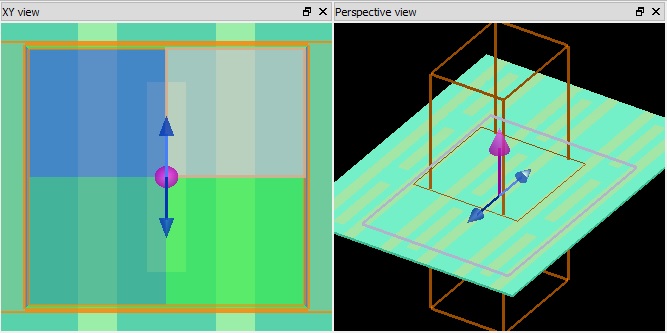
The file negative_index_zhou.fsp contains an example of the structure shown in Figure 1 from Zhou.
The material properties (plasma resonance and collision frequency) were estimated from copper data in the visible. This should be a reasonable estimate of the properties in the microwave range. Initially, this simulation was quite numerically unstable. This turns out to be due to the fact that the permittivity is approximately -2.3e4 + 1.6e7 * i. In other words, the properties are completely dominated by the complex permittivity. To control the instability, the plasma model was replaced by a simple conductive model which can be obtained by an expansion of the plasma model when the collision resonance frequency is much larger than the source frequency. Further testing showed that the results were not sensitive to the precise value of the real permittivity. At the 10-20 GHz frequencies, the imaginary permittivity is so large that the metal behaves like a perfect electrical conductor. The penetration depth is only lambda/10000, which would never be resolved in FDTD anyway. It is surprising that in the paper they explicitly say that they use a Drude model, unless they mean a conductive model which is the limit of the Drude model when \(\omega << \nu_c\). In this simulation, we have used the PEC (Perfect electrical conductor) material model which is appropriate for such situations.
To prevent coupling between the PML above and below the structure and any evanescent fields of the structure, a distance of half a wavelength is left between the structure and PML.
The copper thickness is meant to be 10 um, but this would require a very small mesh size for dz, so we represent the material using 2D sheets.
The conformal variant 1 mesh refinement option is used in this example to take full advantage of the conformal meshing technology to accurately represent the spacing between the wires, and the width of the wires.
Note that some of the dimensions were not well defined in the paper, so the simulation results are similar but do not match exactly. Additionally, the source and receiver used in the experiment are angled at 7.5 degrees from normal, whereas the source in the simulation is injected at normal incidence and the reflection monitor measures the reflected power at angles.
Results
When the simulation is finished, run negative_index_zhou_analysis.lsf to produce the following results:
![]()
The transmission plot which is similar to Figure 2a from Zhou.
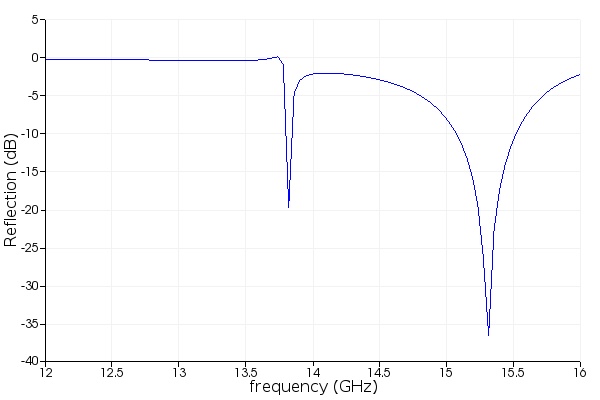
The reflection spectrum which is similar to Figure 2b from Zhou.
Related publications
J. Zhou et al., "Negative index materials using simple short wire pairs", Physical Review B 73 (2006)
See also
Metamaterial simulation methodology