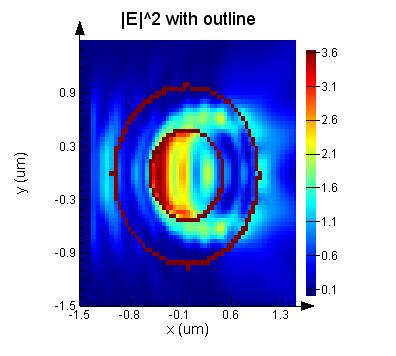
 This page provides an example file which uses the E-field outlined analysis object that creates a plot of |E|^2 with the structure outline. The E-field outlined object can be inserted from the object library in the data representation section. The files in this example were created using FDTD, but the same analysis group can be found in the Component library in MODE.
If you wish to make more sophisticated structure outlines on your figures, the best option is to export the data to another data visualization tool such as Matlab. In addition to exporting the field data, you must export the refractive index data. The refractive index profile can be used to create the structure outline. In Matlab, you might use the contour functions.
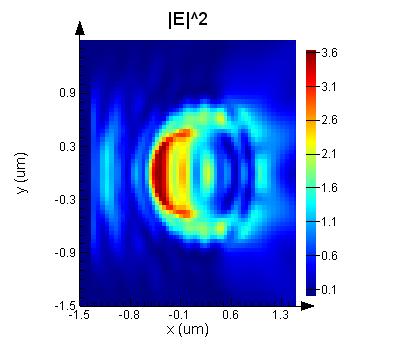
The associated simulation file has an analysis group that returns the field profile with the structure outline super-imposed on the data. To reproduce the above figure, open the simulation file and run the associated script. It will create the following figures: |E|^2 with and without the structure outline.